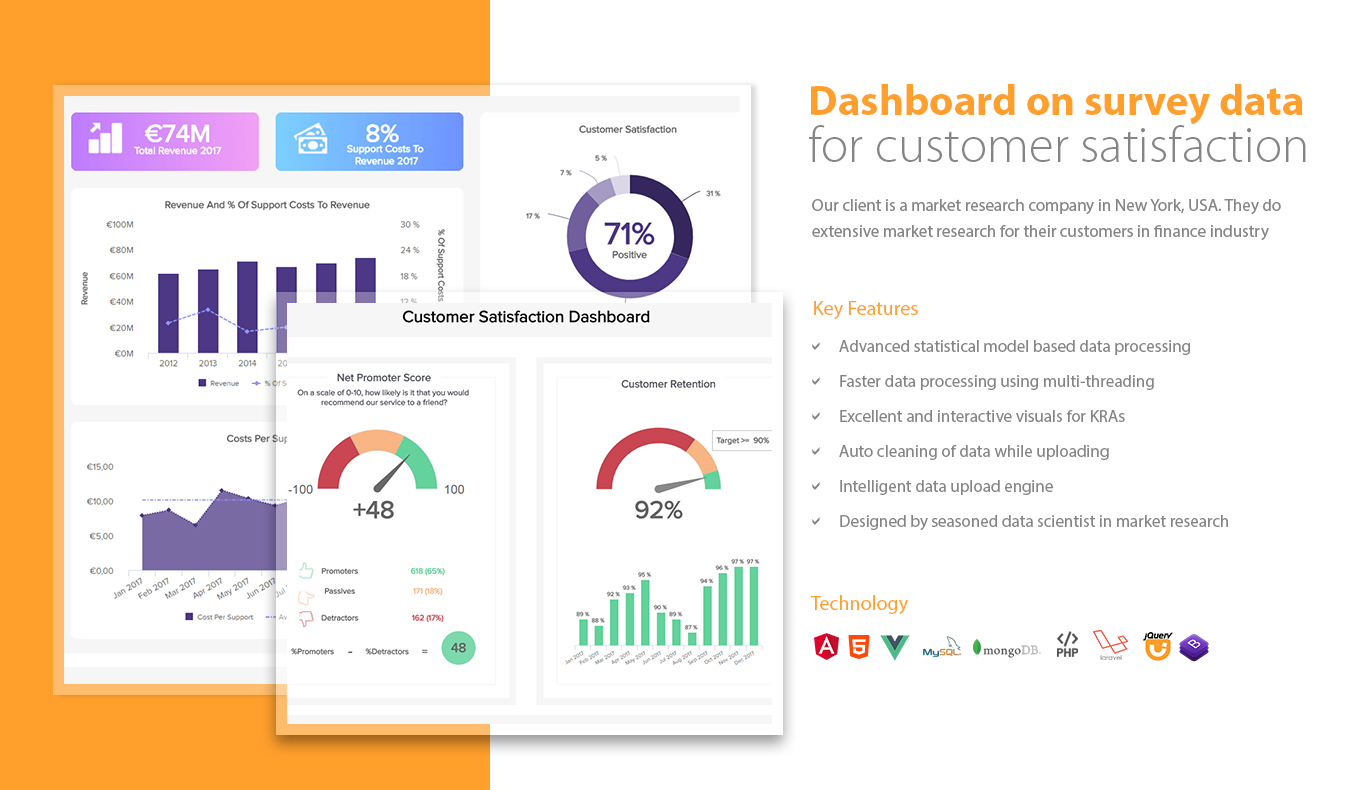
Dashboard On Survey Data For Customer Satisfaction

About the customer
Our client is a market research company in New York, USA. They do extensive market research for their customers in finance industry
The Business Need
Our client required an online dashboard which could produce KPIs visually, by using the raw survey data. These KPIs were for different customer segmented in various products being offered by their customer
The Solution by LipiTech
The data scientists at LipiTech were deployed to apply statical models on raw survey data and also to create visuals of KPIs for different product categories. The software engineers programmed an online dashboard with a user interface for end consumer to view the KPIs with variety of filters. A robust backend was developed to upload the survey data, analyze it for any errors with auto-cleaning mechanism
Impact on the business
The client was able to gain insights on the KPIs related to customer satisfaction easily. The ease of uploading the data and intelligent uploader helped our client to further make necessary tweaks in their survey programming. Our entire solution was very much appreciated
Contact Us
Please fill in the form and we will get back to you in 1 business day.